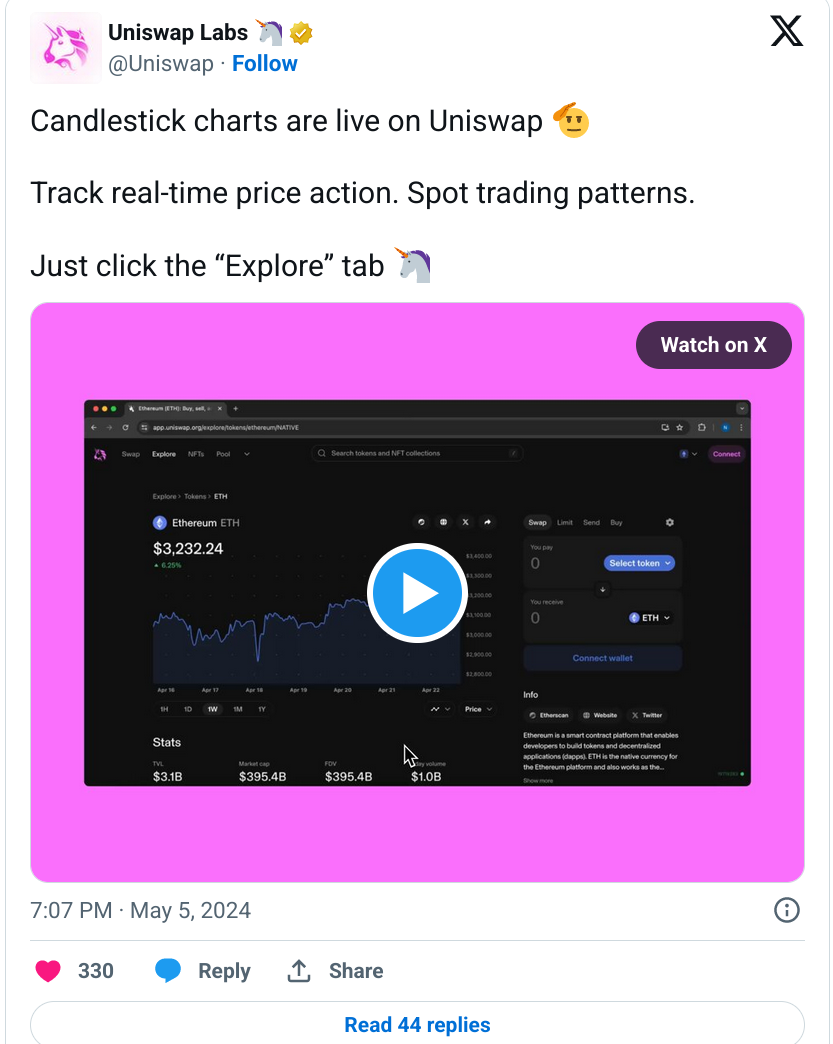
Uniswap has announced that Candlestick charts have gone live on the network
Candlestick charts have been in use in the crypto industry for some time. They are being used by various exchanges and ecosystems to keep investors and users informed about the price movement of tokens and other assets

Uniswap continues to improve its services for users. Recently, it announced the launch of candlestick charts, which will help users make financial decisions. The candlestick chart feature is now live on the network and interested users can utilize it.
A Candlestick chart is an essential function that can help in making financial decisions based on the performance of an asset. In cryptocurrencies or other assets, it is the visual representation of trading activity. Therefore, an investor can make informed decisions within a few minutes without consulting a variety of resources.
These charts provide comprehensive information, including the asset's opening and closing price. Additionally, it offers insights into the highest and lowest prices, as well as the price movement. The price movement of an asset can be tracked in both the long and short term, allowing the investor to determine whether to pursue an asset or abandon the idea.
Candlestick charts have been in use in the crypto industry for some time. They are being used by various exchanges and ecosystems to keep investors and users informed about the price movement of tokens and other assets.
Uniswap had plans to introduce the candlestick charts function to the system but was working on it. In a recent announcement, it stated that the function has been integrated into the system and is now live.
Uniswap announces live candlestick charts
The official Twitter/X account of UniswapLabs announced that the candlestick charts function has gone live and users can utilize it. All they need to do is click the explore button and it will open up a new world for them.


